Observatory
Cost tracking, OpenTelemetry pipeline, mission-control HUD, Grafana board, audit log. Observatory answers the question "why did the AI bill quadruple?" with a live, per-tenant breakdown you can read directly.
Two dashboards read the same telemetry stream so they never disagree: the mission-control HUD for live operations (agents on a graph, missions in flight, fleet posture across the top) and the Grafana board for analytics, finance, and historical query.
The dashboards on this page are rendered from a real run of Example 43 — not pre-canned, not synthesised. Every panel is sourced from real HTTP traffic against a real admin backend. To reproduce them yourself, run the example: it brings the dashboards to life in about three minutes on a clean machine.
Prerequisites: Docker, the Sagewai admin backend, and an API key. See getting started.
What you can do with it
- Track cost per project, per model, per token. Every span is tagged with
sagewai.project_id; per-tenant rollups drop out of the dashboard automatically. - Watch missions live. The mission-control HUD streams agents, mission state, fleet posture, and live cost-per-run.
- Read finance-friendly dashboards. The Grafana board ships with five rows and 14 panels: system health, HTTP performance, status codes, OTel pipeline health, structured logs.
- Audit business events. Structured events (
setup.completed,auth.login.*,agent.created,agent.run.*,provider.test.*) land in the log store and are queryable from the audit view. - Export to your SIEM. The OTel pipeline emits OTLP; point an external collector at the same backend you use for the rest of your services.
Two surfaces, one telemetry stream
The HUD reads from the live REST API for the immediate state of agents, missions, and fleet. The Grafana board reads from VictoriaMetrics (metrics, scraped from the OTel collector's Prometheus endpoint every 10 seconds) and VictoriaLogs (logs, exported via OTLP). The same OTel collector serves both — no shadow pipeline, no demo-only data path.
Bring the stack up and drive load
Three commands in three terminals. The first two bring the stack up; the third drives the realistic mixed-tenant load that produced the screenshots below.
# Terminal 1 — observability
docker compose -f docker-compose.observability.yml up -d

# Terminal 2 — admin backend (instrumented FastAPI)
sagewai admin serve --host 127.0.0.1 --port 8000

# Terminal 3 — drive load (Tuesday morning at a 200-person SaaS)
python packages/sdk/sagewai/examples/43_observatory_live.py
That gives you:
- Grafana at
http://localhost:3000(admin / admin, anonymous viewing enabled) - VictoriaMetrics at
http://localhost:8428(Prometheus-compatible query API) - VictoriaLogs at
http://localhost:9428 - OTel Collector at
localhost:4317(gRPC) /localhost:4318(HTTP)
For the mission-control HUD, additionally start the admin frontend
(just admin-dev) and visit /hud-ironman. The HUD is admin-only;
the Grafana board is anonymous by default for read access.
The mission-control HUD
The HUD is the dashboard you put on the projector. 1920×1080
canvas — agents on the graph, missions in flight, fleet posture across
the top, an event ticker down the side. Mode badge in the topbar
says LIVE when the backend is reachable, DEMO · BACKEND OFFLINE
when it isn't, so you can never confuse a screen recording for a
live system.
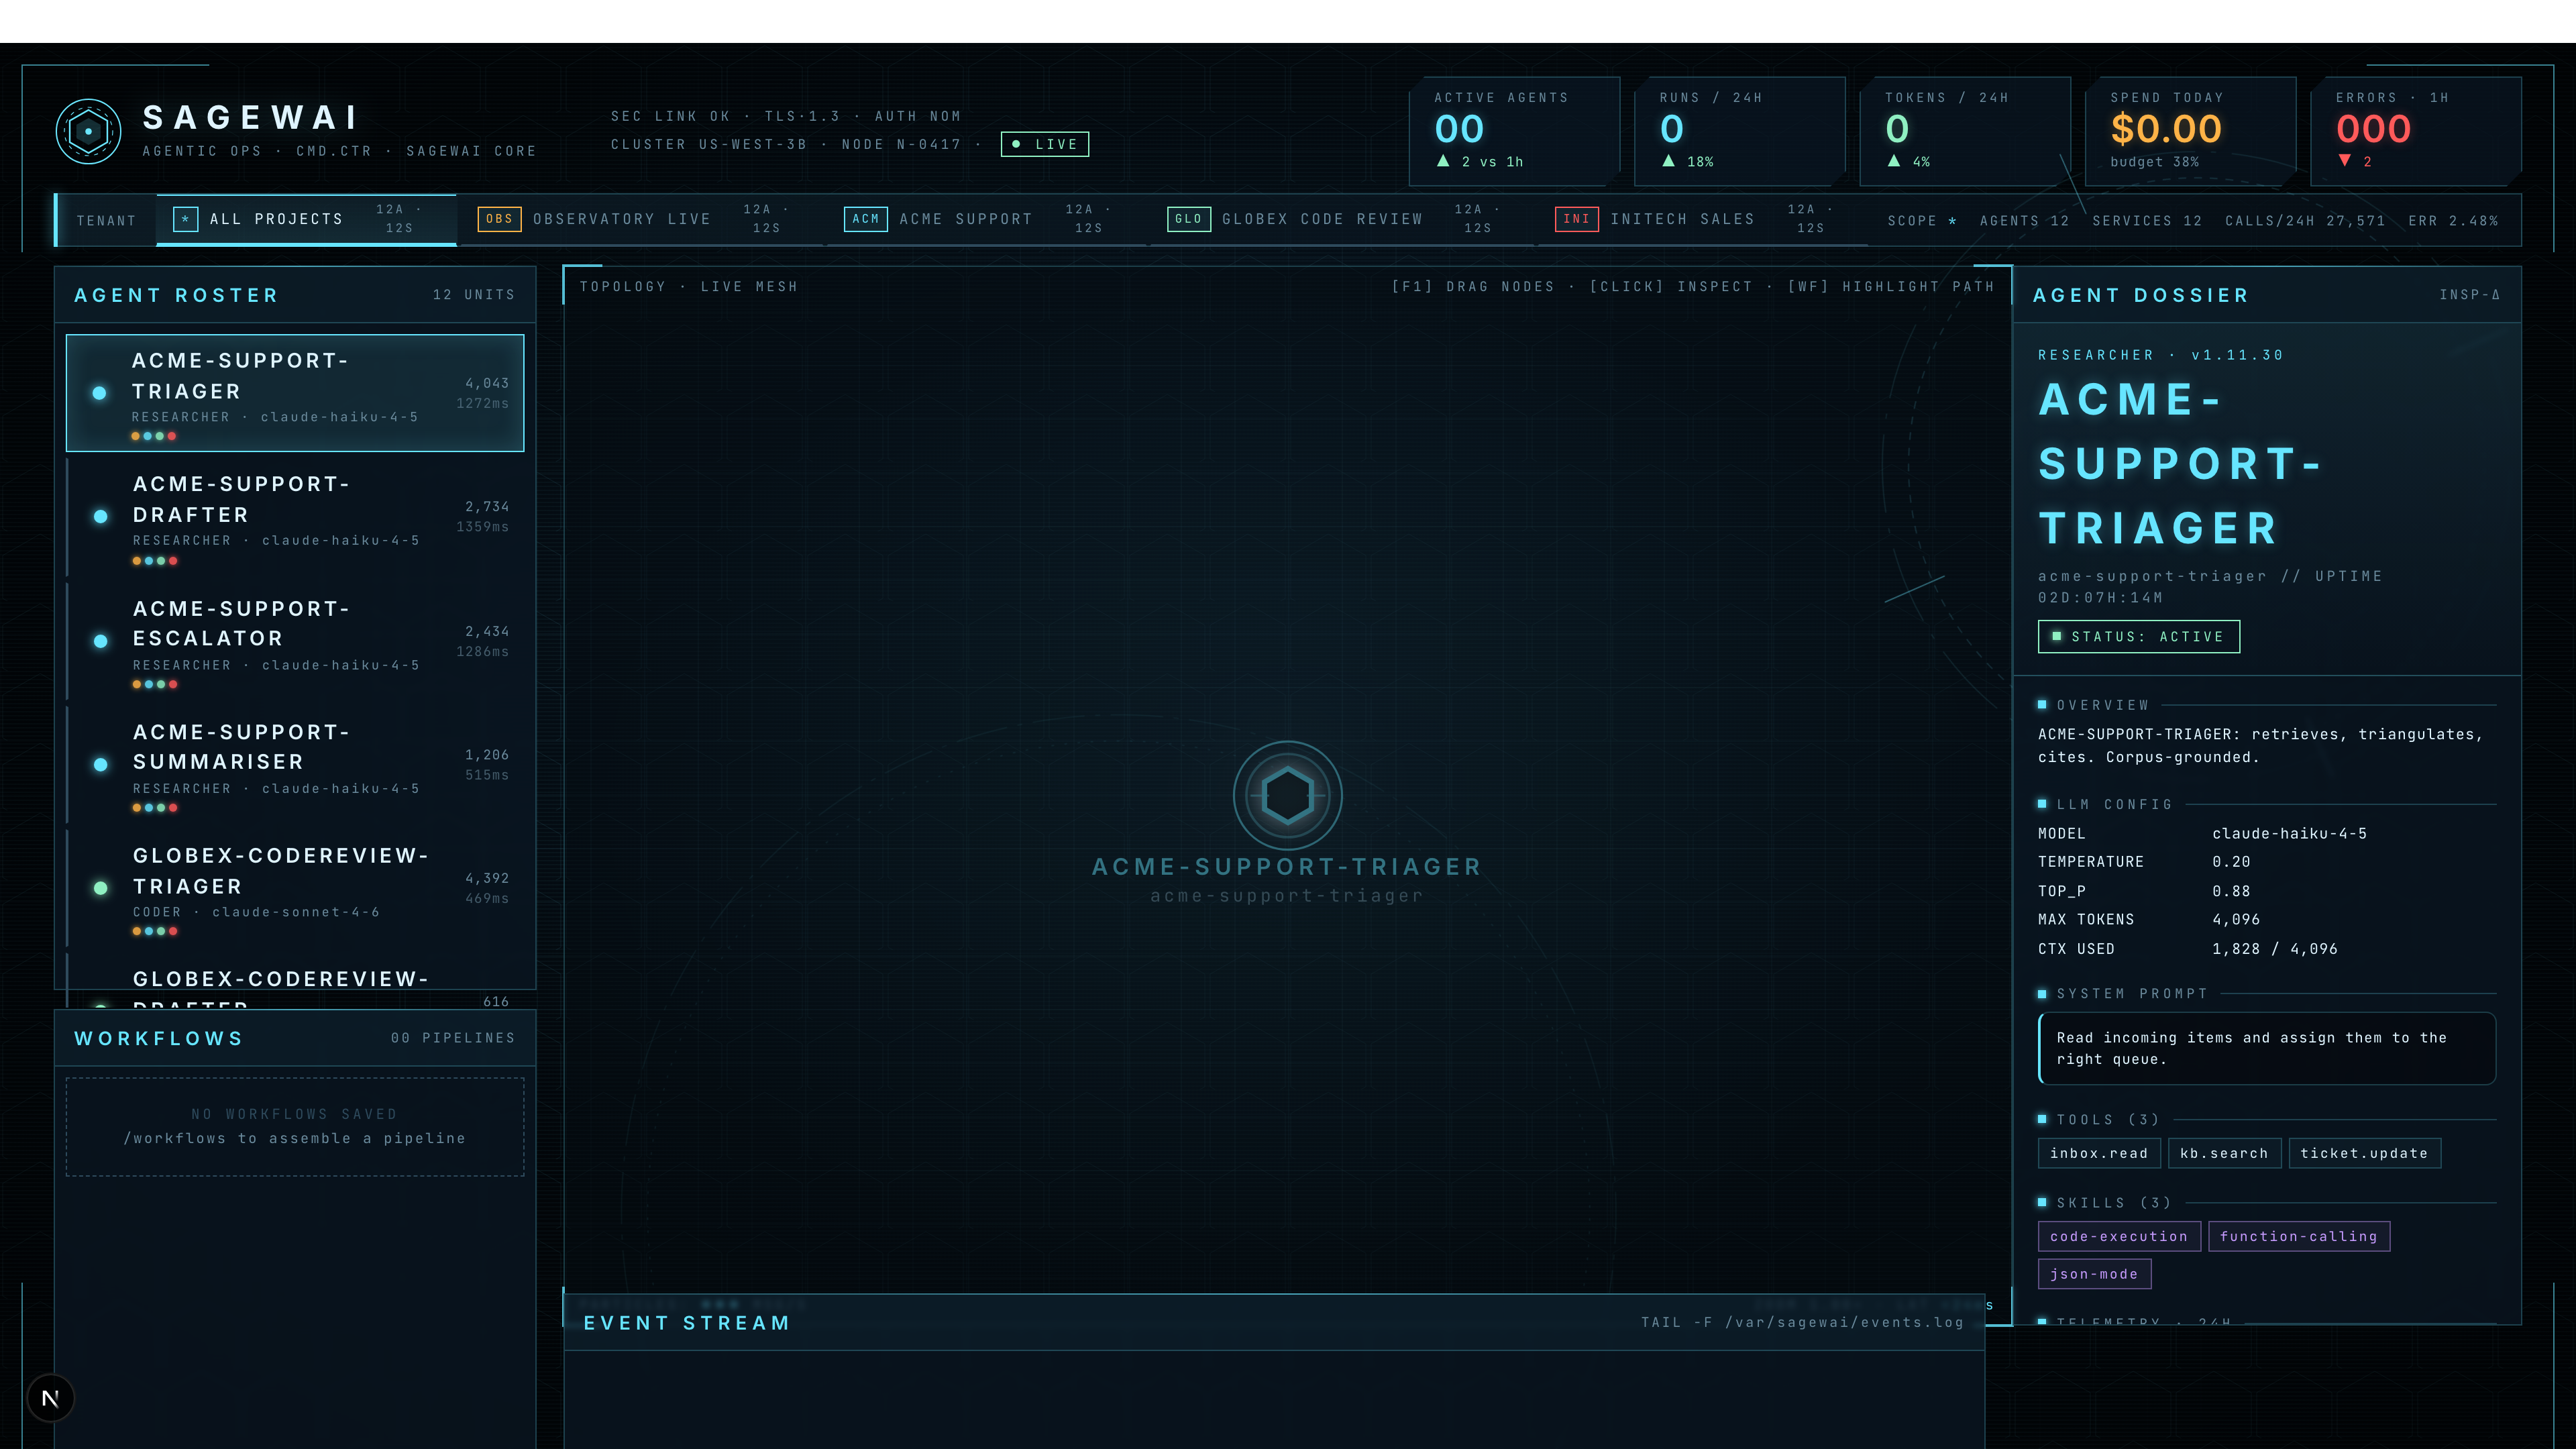
The captured screenshot above shows Example 43 mid-run: the agent roster lists Acme Support's four agents and Globex Code Review's agents, the inspector pane on the right shows the model + temperature
- tools for the selected
acme-support-triager, and the project bar across the top lets you switch tenants.
The topbar carries five KPIs that are pre-attentive — visible from across a meeting room:

The Grafana board
Five rows. Top to bottom, the story flows from "is the platform healthy" → "where is the latency" → "what's failing" → "is the telemetry pipeline itself OK" → "show me the actual log lines."
Row 1 — System Health
Four stat panels: Request Rate, Error Rate (5xx), Active Requests, Avg Latency. The "is anything red right now" view.
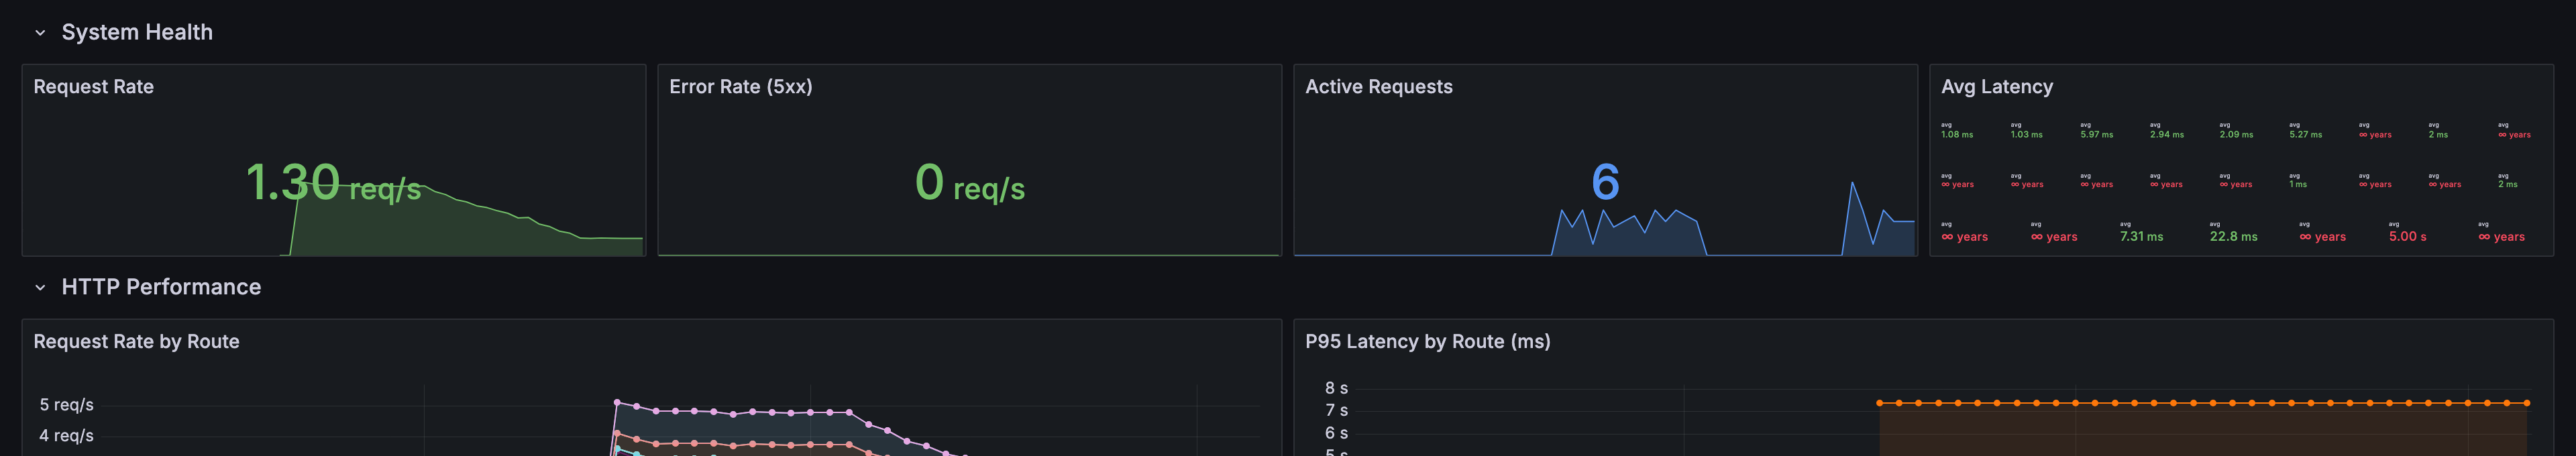
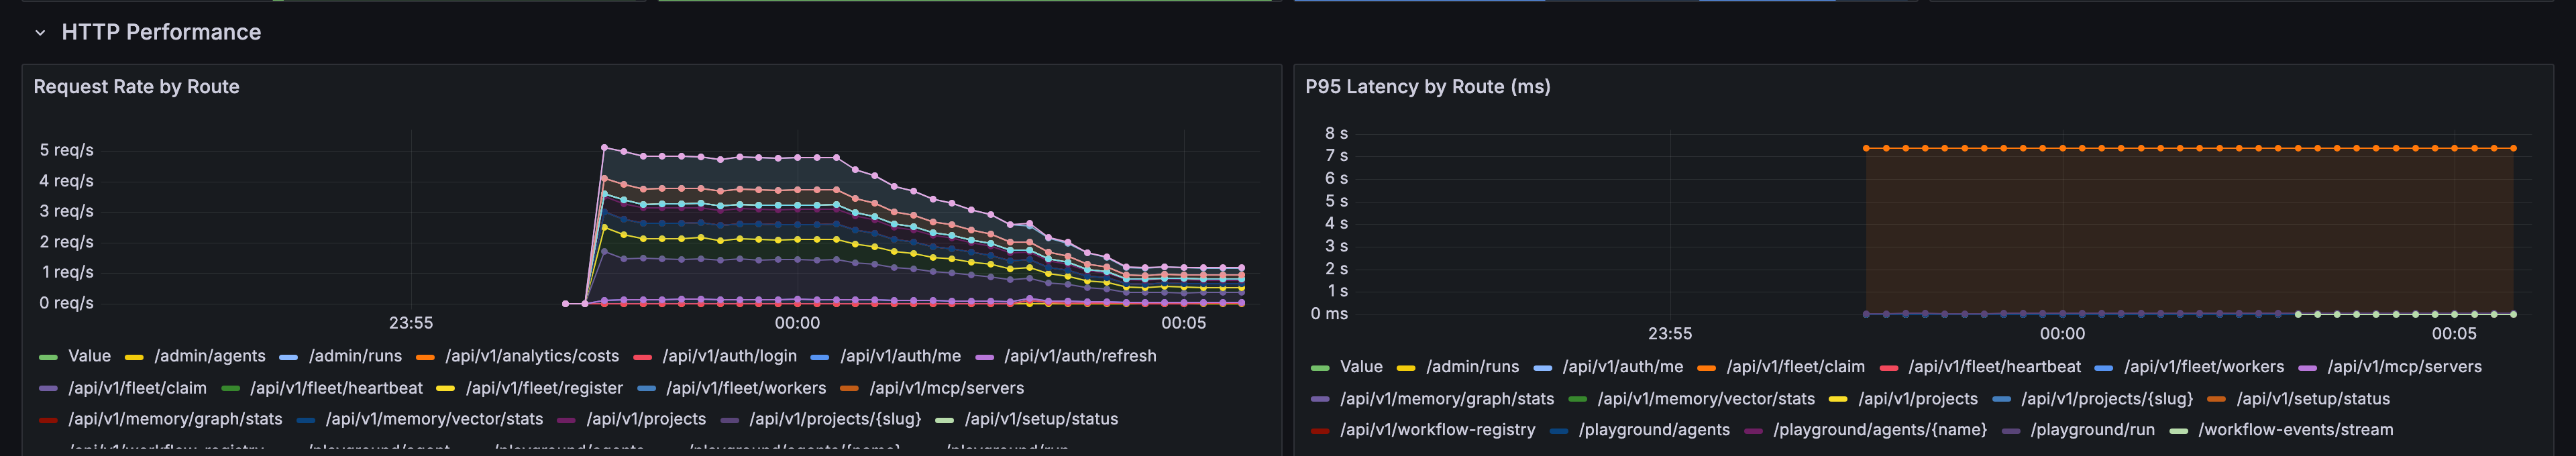
Row 2 — HTTP Performance
Per-route request rate and p95 latency. One line per route — the example exercises 14 different admin endpoints, all of which show up here.
Row 3 — Requests by Status
Stacked status-code distribution + response-size p95. The example deliberately fires a few 401/404 probes so the Status Code panel has more than one band.
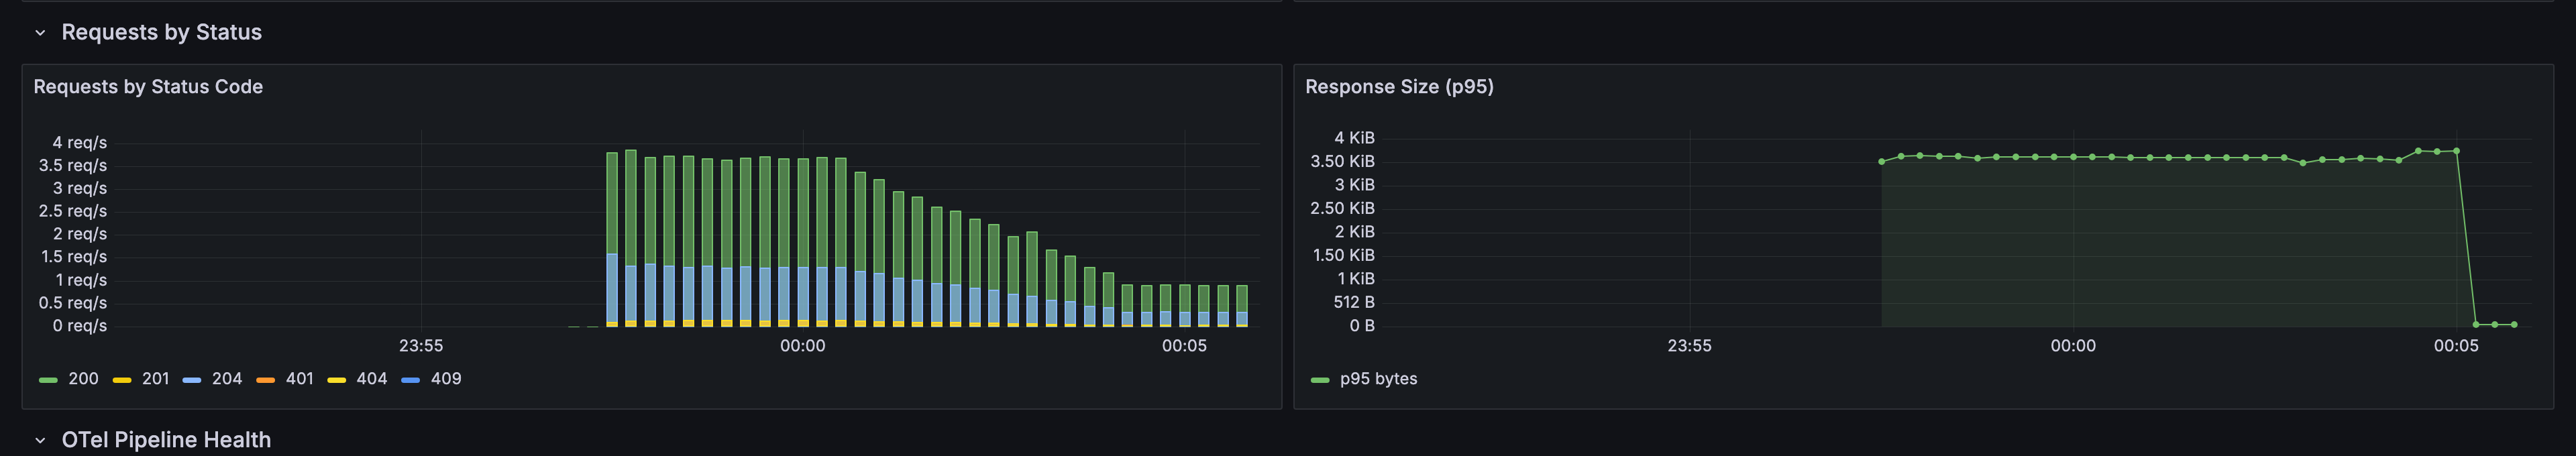
Row 4 — OTel Pipeline Health
Spans processed, log records sent, log queue size. The "is the telemetry pipeline itself the problem" view — when data goes missing, this row is where the answer lives.

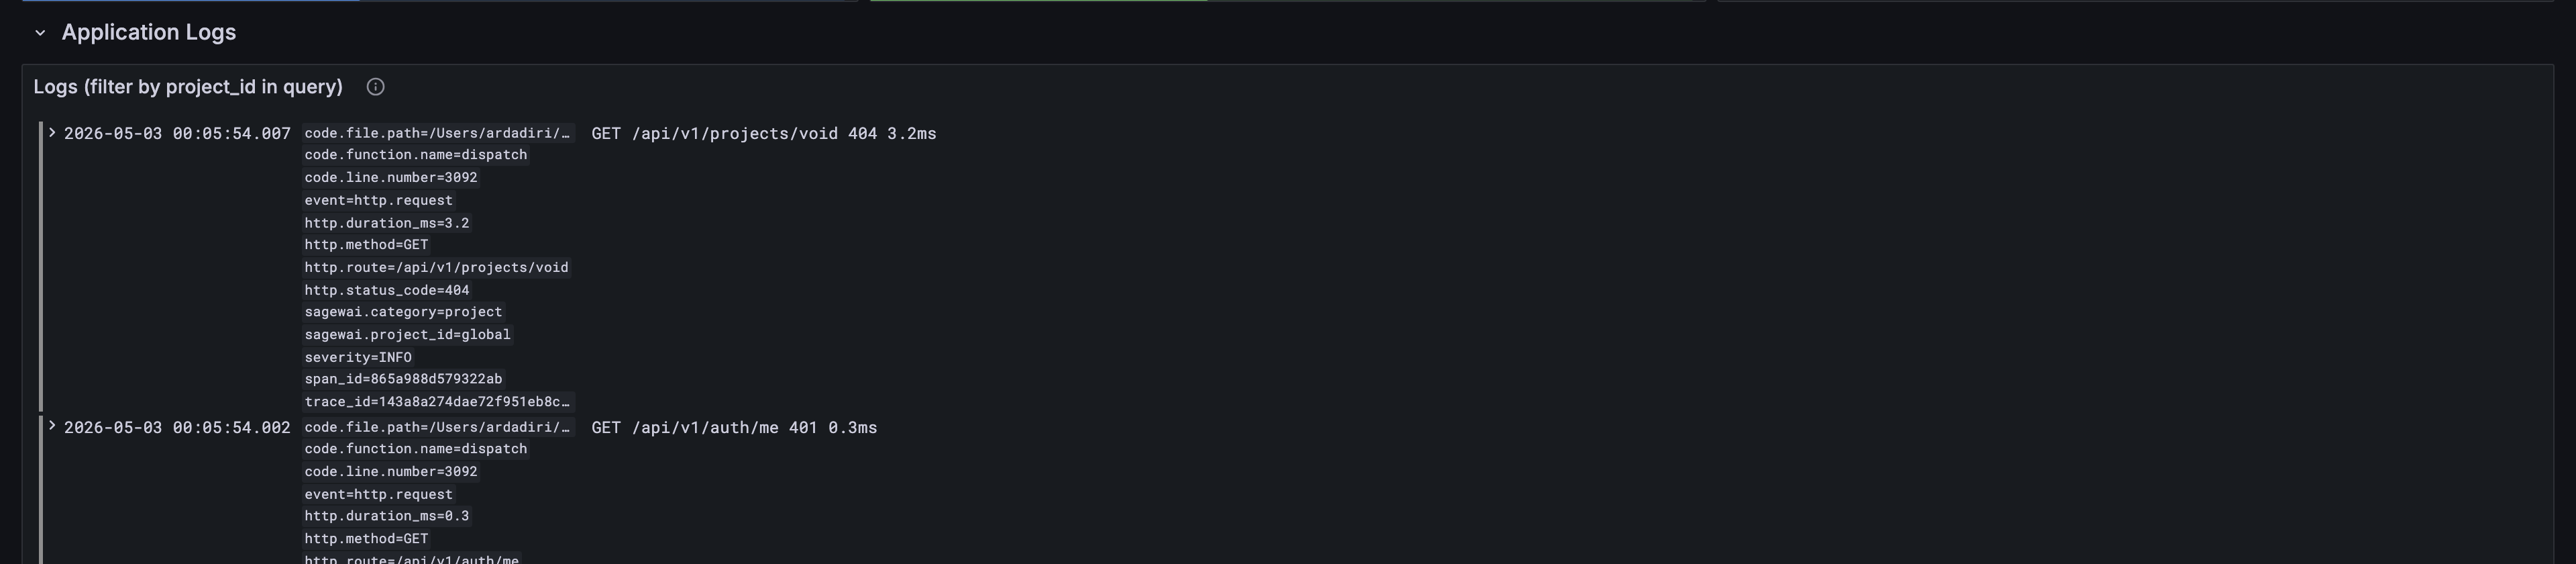
Row 5 — Application Logs
Live-tail of structured admin events. Sagewai backends emit business
events as logs, so this panel doubles as an audit feed:
agent.created, agent.run.*, auth.login.*, setup.completed,
provider.test.*. Filter by project_id in the panel query box to
see only one tenant's activity.
When to look at which
| You are about to | Open this |
|---|---|
| Demo Sagewai to a non-engineer (CEO, customer, all-hands) | Mission-control HUD |
| Investigate a slow request or a 5xx spike | Grafana Dashboard |
| Check whether a specific project's run is making progress | Mission-control HUD — switch the project bar |
| Build an alerting rule for production | Grafana Dashboard — copy the panel's PromQL |
| Audit which routes are getting hammered | Grafana Dashboard — Request Rate by Route panel |
| Watch a Fleet under load (Example 40) | Both — HUD for the picture, Grafana for the numbers |
Bring your own observability stack
The compose stack is a complete batteries-included setup, but most
teams already pay for Datadog, Grafana Cloud, or run their own Prometheus/Loki. The OTel collector is the
only fixed seam — point your existing endpoint at the
http_server_* metrics it exposes on :8889 and the dashboards work
unchanged. The provisioning files in observability/grafana/ are
runnable locally and copy-pastable into Grafana Cloud's import flow.
There is no Sagewai-hosted observability tier. Your telemetry never leaves your infrastructure unless you explicitly route it somewhere.
Anti-patterns
-
Treating the HUD as the alerting surface. The HUD is a live picture; it has no history, no PromQL, no alerts. Use Grafana for "wake me up at 3am" rules.
-
Treating Grafana as the demo surface. Grafana is honest but not photogenic. Don't try to win a CEO with a panel of timeseries charts; that's what the HUD is for.
-
Wiring custom metrics to a sidecar Prometheus. The OTel collector is the seam. New metrics should be emitted via OTLP and picked up by the existing pipeline, not exported on a side channel that the dashboards don't see.
-
Using
prometheusremotewriteto ship to VictoriaMetrics. Known footgun — silently drops histograms and counters. The shipped pipeline uses the Prometheus exporter on:8889+ VM scraping, not remote-write. Don't change this without reading the comment inobservability/otel-collector/config.yaml.
See also
- Fleet — per-worker telemetry that Observatory aggregates.
- Security overview — the redaction layer that makes telemetry safe to export.
- Cost management guide — how budget caps, cost meters, and per-team attribution are wired in the SDK.
- Fleet enterprise architecture — the multi-tenant story the dashboards are scoped to.
- Architecture overview — the control-plane / fleet split that produces the telemetry stream this page renders.
- All products — the other components.
Runnable examples on GitHub:
- Example 43 — Observatory live — the load driver that produced every screenshot on this page.
- Example 34 — Observatory cost tracking — per-tenant cost tracking.
- Example 40 — Fleet under load — generates pure fleet-dispatch load (no admin backend required).